Feature Selection and Cost Analysis
Contents
- Introduction
- Data processing
- Predictive performance from each feature category
- Cost assumptions by feature category
- Forward stepwise process to select cost efficient feature sets
Introduction
This section includes an analysis of the different feature categories included in the data (e.g. Cognitive tests, Demographic factors, MRI). Whereas the previous section considered a range of different modeling methods this section focuses on understanding the relative strengths of the different feature categories. Firstly, the predictive performance of each feature category on its own is considered. Then a process is developed to fit a model with a selected subset of feature categories based on a trade off between several qualities of the category such as the medical cost, early detection capability and invasiveness versus the category’s predictive performance.
Data processing
The same data processing steps used to create the baseline models are followed for this section. The only additional requirement was developing a process to efficiently subset the predictors of interest and not having to re-process (train/test split, imputation, etc.) the data for each model.
A summary of the feature categories considered and the number of predictors per category is provided below:
| Number of predictors | |
|---|---|
| Feature Category | |
| CSF | 3 |
| Cognitive tests | 23 |
| Cognitive tests (ADAS) | 13 |
| Demographics | 90 |
| Genetic markers | 3 |
| MRI (Cross-sectional) | 346 |
| MRI measures | 7 |
| PET measures | 3 |
Predictive performance from each feature category
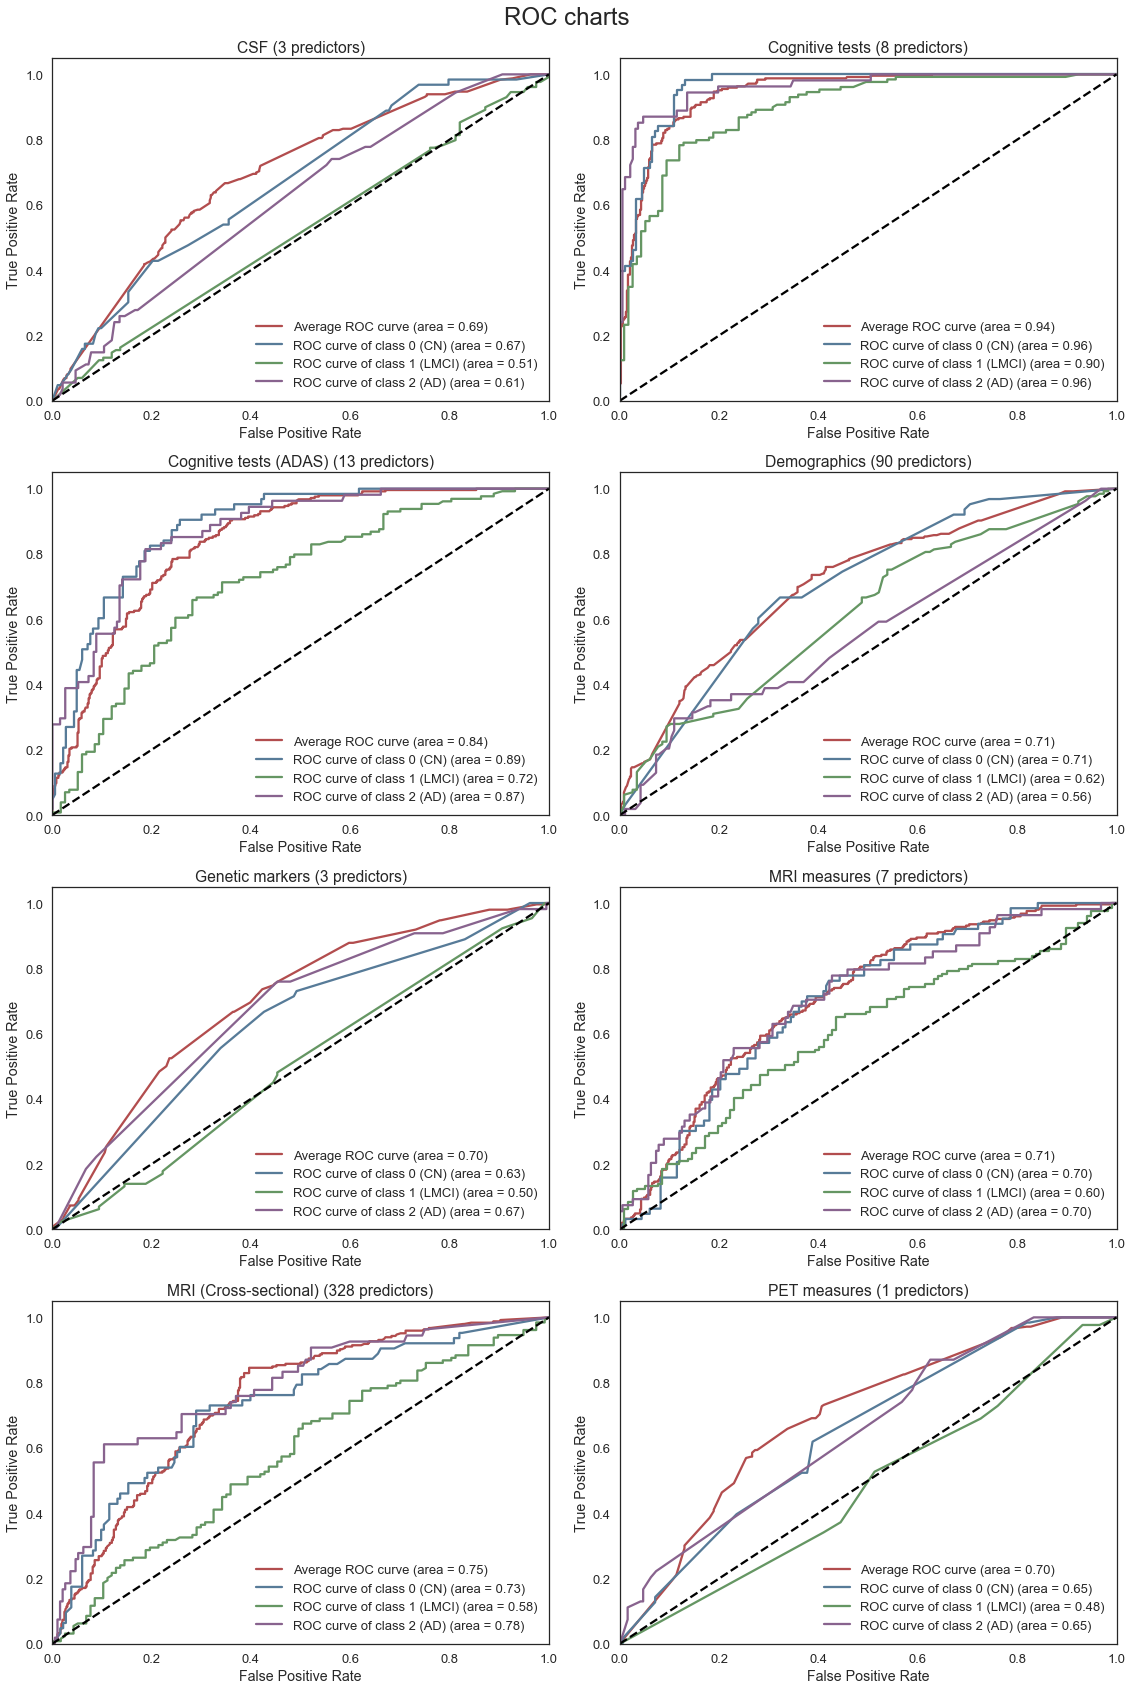
Separate Gradient Boosted models are fit using only features from each of the categories displayed above. The parameters of the model are tuned using grid search with cross-validation. The ROC plots and corresponding AUC for each model are then compared to provide some insight into the relative predictive performance of each individual set of features (e.g. MRI vs Cognitive Tests). Feature importance plots are also created to provide a better understanding of the importance of individual features within each category as well.
The ROC curves below provide an indication of the predictive strength of each of the models. Separate ROC curves are created for each of the classes in the model (CN, LMCI, AD) as well as an average for all the classes. From the charts below we note the following:
- The Cognitive test features provides the best predictive performance, followed by the MRI measures. This is not unexpected given the relevance of these features in diagnosing Alzheimer’s. However, we know that these features are only really effective in predicting Alzheimer’s in the later stages of the disease progression. Thus, if we further increased the weight of importance for model’s early disease detection capability, the best predictive performance is provided by CSF category instead.
- Of note, we removed the “CDRSB” cognitive test (Clinical Dementia Rating) from the Cognitive tests category for our model given we found this feature was likely a factor used to determining our chosen response “DX_bl”, and thus we could not use this feature as a predictor
- The CSF, Genetic marker, MRI (Cross-sectional), and PET features can only really distinguish between CN and AD and do not provide useful information regarding LMCI diagnosis.
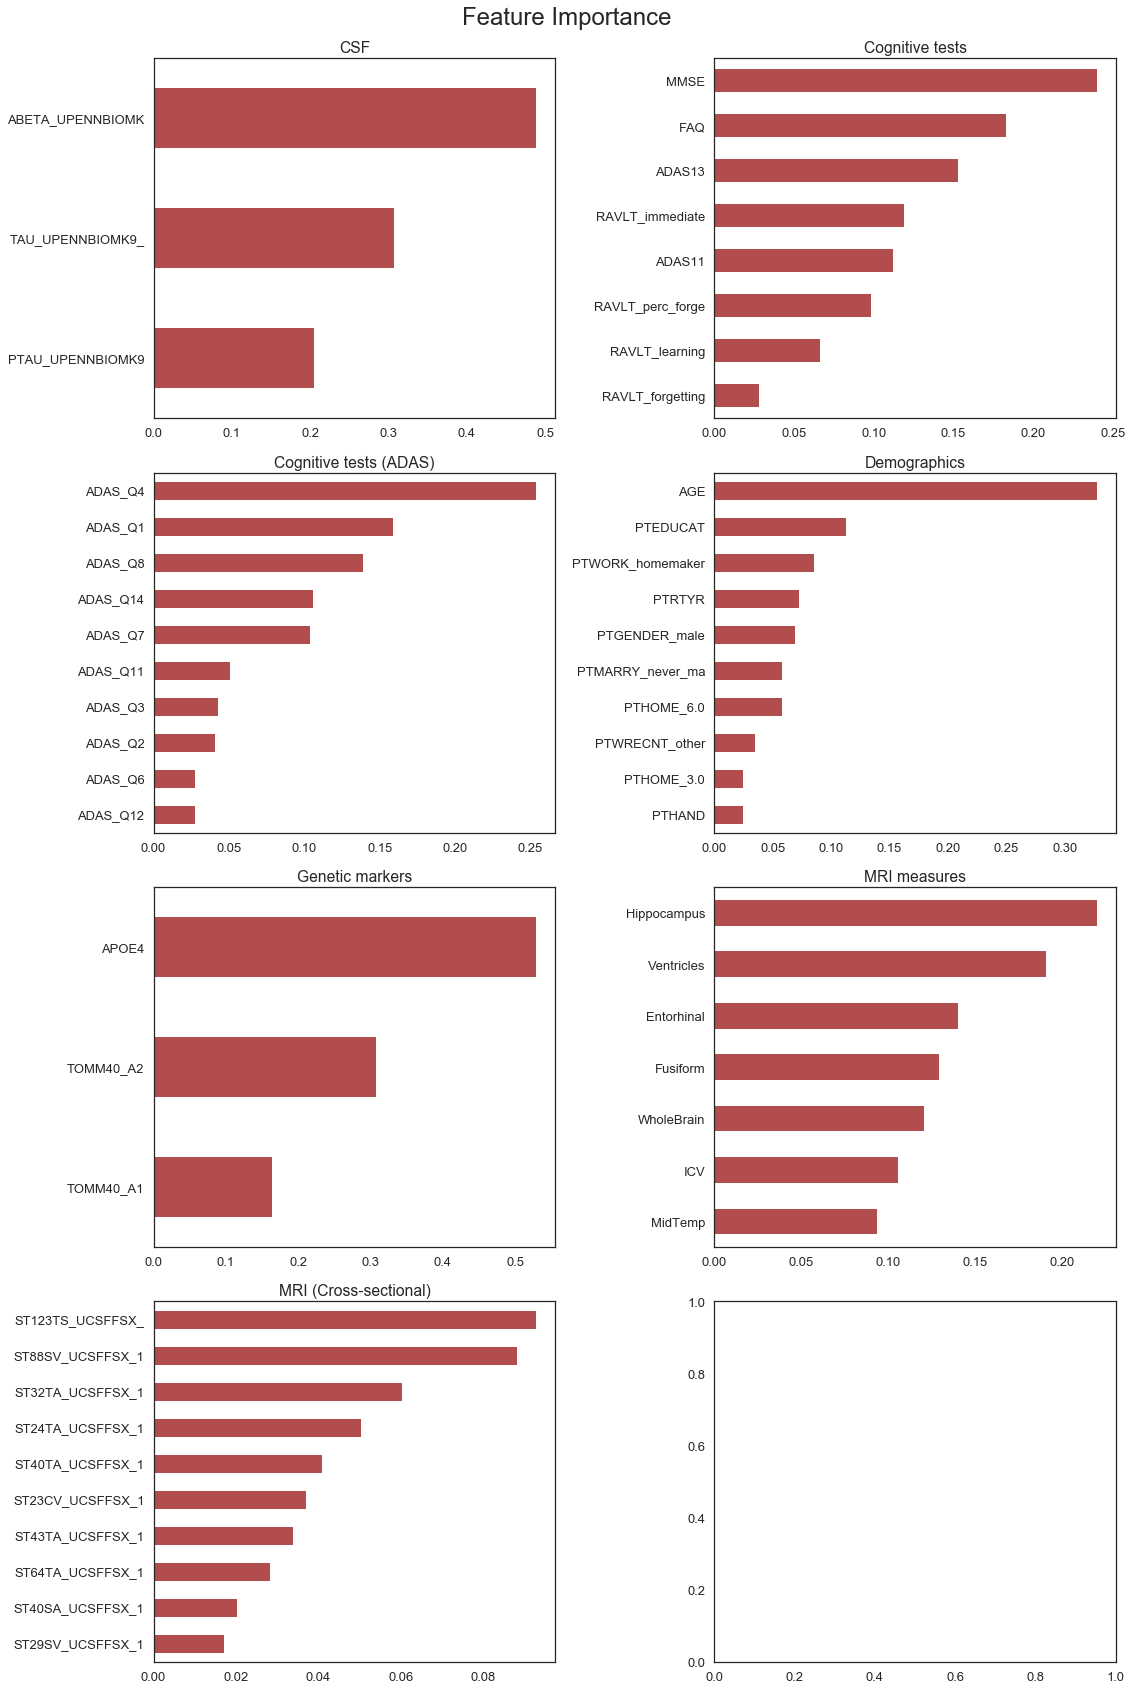
The charts below provide some interesting insight into the relative importance of individual features within each category. In particular, we make the following observations:
Cognitive tests: The MMSE (Mini-Mental State Exam) appears to be the most important cognitive test, followed by FAQ (Functional Activities Questionnaire) and the ADAS (Alzheimer’s Disease Assessment Scale) cognitive tests.
Cognitive tests (ADAS): Not all the ADAS questions appear to be equally important. Questions 1, 4 and 7 appear to be the most influential in the model. More detailed analysis on the individual questions are included in the next section of the report.
Demographics: Age and years of education are known risk factors. Interestingly, it appears that whether a person was a home-maker for most of their life and the age at which they retired also appears to be influential factors.
Family history: The most important factor is FHQMOMAD, which indicates whether the participant’s mother was diagnosed with Alzheimer’s disease (FHQPROV stands for family history questionnaire).
Genetic markers: APOE4 is the most important factor. Notably, APOE4 a protein which is a known risk factor of developing Alzheimer’s disease found in previous academic studies.
MRI measures: Hippocampus volume showed to be the most important indicator. This is consistent with our observation from the EDA, where the volume of Hippocampus of a patient decreased from diagnosis as Cognitively Normal towards Alzheimer’s disease.
Cost assumptions by feature category
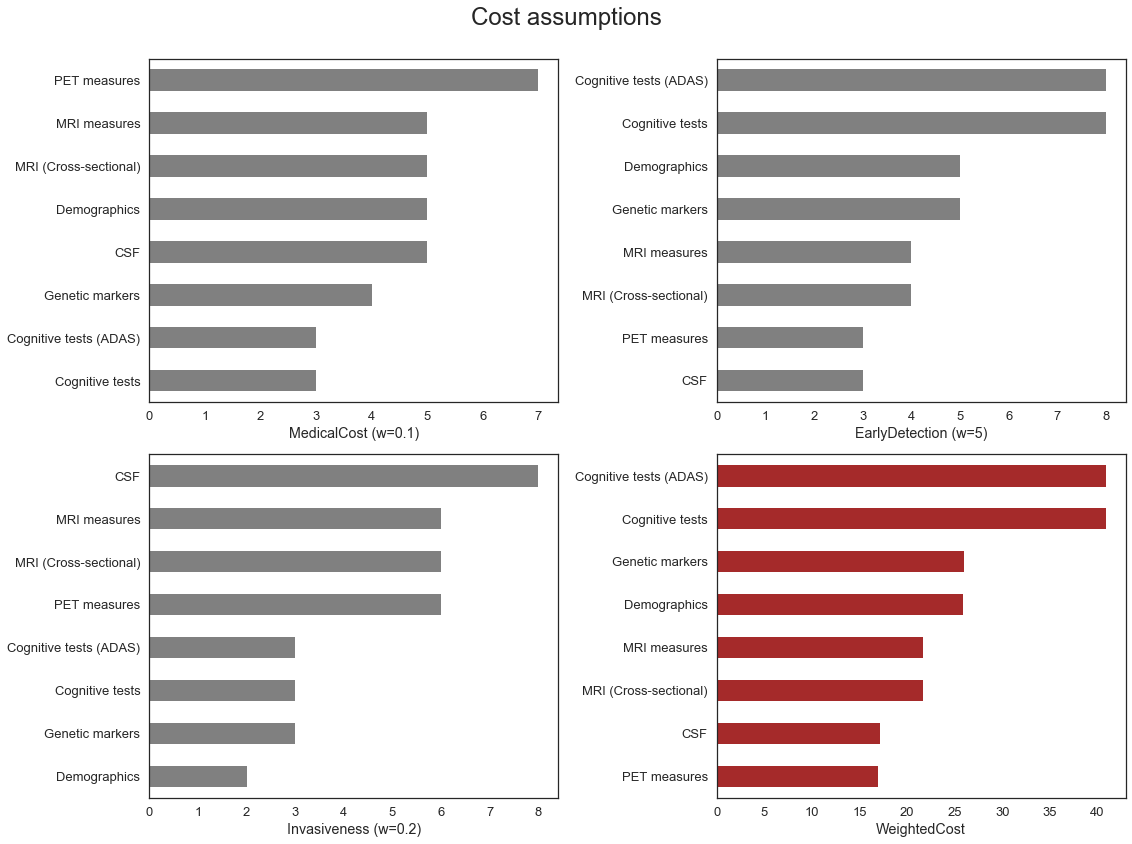
Each of the feature categories has different characteristics with regard to predictive performance, as demonstrated in the previous section, but also with regard to medical cost, early detection ability and invasiveness of procedure to collect the data.
Cognitive tests: Cognitive tests are important in Alzheimer’s disease because they measure cognitive decline in a direct and quantifiable manner. However, these tests also have several limitations in that they suffer from practice effects and patients who undertake the same test several times can obtain inflated scores. The tests are also not very useful for early detection.
CSF measures: Abnormal levels of amyloid-beta and tau/p-tau protein concentrations in the cerebrospinal fluid (CSF) are some of the earliest signs of Alzheimer’s disease and can indicate abnormalities many years before symptoms onset. As such, these tests could be very valuable for early detection. However, in order to collect the fluid a lumbar puncture needs to be performed, which is highly invasive.
Demographics / Family history: Known risk factors include age, gender and eduction. Demographic factors are easy to collect and non-invasive, but can lack sufficient predictive power.
Genetic Markers: Collection of genetic markers for genotyping only requires a small sample of blood, with medium cost for laboratory analysis work. It is known that the protein APOE4 is a known risk factor.
Family History: The precedent of Alzheimer’s disease incidence in patient’s relatives could be a cost-effective decision factor for further early diagnosis testing when a patient lacks other symptoms.
MRI / PET measures: Quantification of atrophy and molecullar processes in the brain with MRI and PET scans are very important biomarkers as these tests are widely available and non-invasive. Of note, MRI scans are relatively cheaper than PET.
| MedicalCost (w=0.1) | EarlyDetection (w=5) | Invasiveness (w=0.2) | WeightedCost | |
|---|---|---|---|---|
| Feature Category | ||||
| Cognitive tests | 3 | 8 | 3 | 40.9 |
| Cognitive tests (ADAS) | 3 | 8 | 3 | 40.9 |
| CSF | 5 | 3 | 8 | 17.1 |
| Demographics | 5 | 5 | 2 | 25.9 |
| Genetic markers | 4 | 5 | 3 | 26.0 |
| MRI (Cross-sectional) | 5 | 4 | 6 | 21.7 |
| MRI measures | 5 | 4 | 6 | 21.7 |
| PET measures | 7 | 3 | 6 | 16.9 |
The table above includes some subjective cost assumptions by category for the different cost considerations outlined above. The assigned values are on a 10-point scale (0-9) and have been combined using a weighting approach to provide a ‘weighted cost’ measure.
No formal research has been conducted to obtain the cost assumptions. The intention is to provide a framework that subject matter experts can use to include more subjective considerations that would influence the set of features included in the final model.
For example, if early detection is really important, then a large weight could be allocated to that component (See Scenario 2). As a result, models with features that are not perceived to be useful for early detection (e.g. Cognitive tests) would be penalized more even though the model accuracy might be lower and the ones contributing (e.g., CSF, PET) will be penalized less.
Similarly, if we assign a large weight to the medical cost (see Scenario 3), perhaps when a cost-sensitive clinician wants to make a data-driven decision on the diagnostic tests, the model will preferentially select lower-cost categories first, such as Cognitive tests, which is a trade-off for early detection model capacity.
Forward stepwise process to select cost efficient feature sets
This section outlines a forward stepwise selection process, which was developed to select feature categories to include in a model. The process starts with a null model and then sequentially adds the feature category that maximizes a performance/cost measure based on both the accuracy of the model and the cost of the feature category used in the model. The ‘best’ set of features is added at each step until all the features have been added. At each step the accuracy, cost and ‘score’ (based on accuracy and cost) are measured. The output can therefore be used to find the best subset of features for a required level of accuracy or maximum allowed cost.
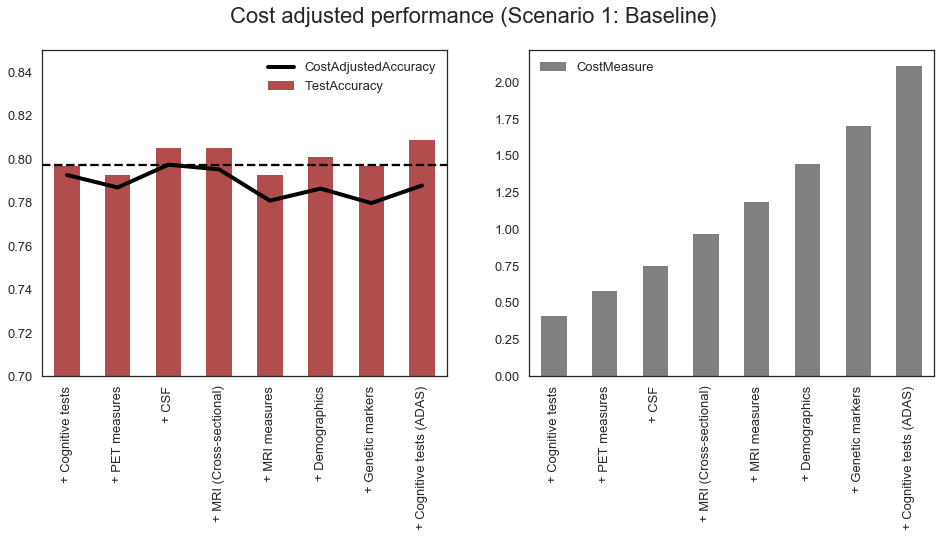
Scenario 1: Baseline
The table below summarizes the order in which feature categories were added to the model and the relevant accuracy and cost measures at each stage.
| ValidationAccuracy | TestAccuracy | CostMeasure | Score | |
|---|---|---|---|---|
| + Cognitive tests | 0.7592 | 0.7967 | 0.409 | 0.3502 |
| + PET measures | 0.7557 | 0.7927 | 0.578 | 0.1777 |
| + CSF | 0.7539 | 0.8049 | 0.749 | 0.0049 |
| + MRI (Cross-sectional) | 0.7609 | 0.8049 | 0.966 | -0.2051 |
| + MRI measures | 0.7627 | 0.7927 | 1.183 | -0.4203 |
| + Demographics | 0.7644 | 0.8008 | 1.442 | -0.6776 |
| + Genetic markers | 0.7679 | 0.7967 | 1.702 | -0.9341 |
| + Cognitive tests (ADAS) | 0.7661 | 0.8089 | 2.111 | -1.3449 |
The charts below shows that cost-adjusted accuracy as well as the total cost at each stage of the process. The cost-adjusted accuracy is somewhat variable between steps, but still provides useful information about the optimal set of features for the given cost assumptions. In the chart below the optimal set of features (i.e. where the cost-adjusted accuracy is maximized) includes the following feature categories: Cognitive tests, PET measures, CSF and MRI.
Scenario 2: High importance of early detection
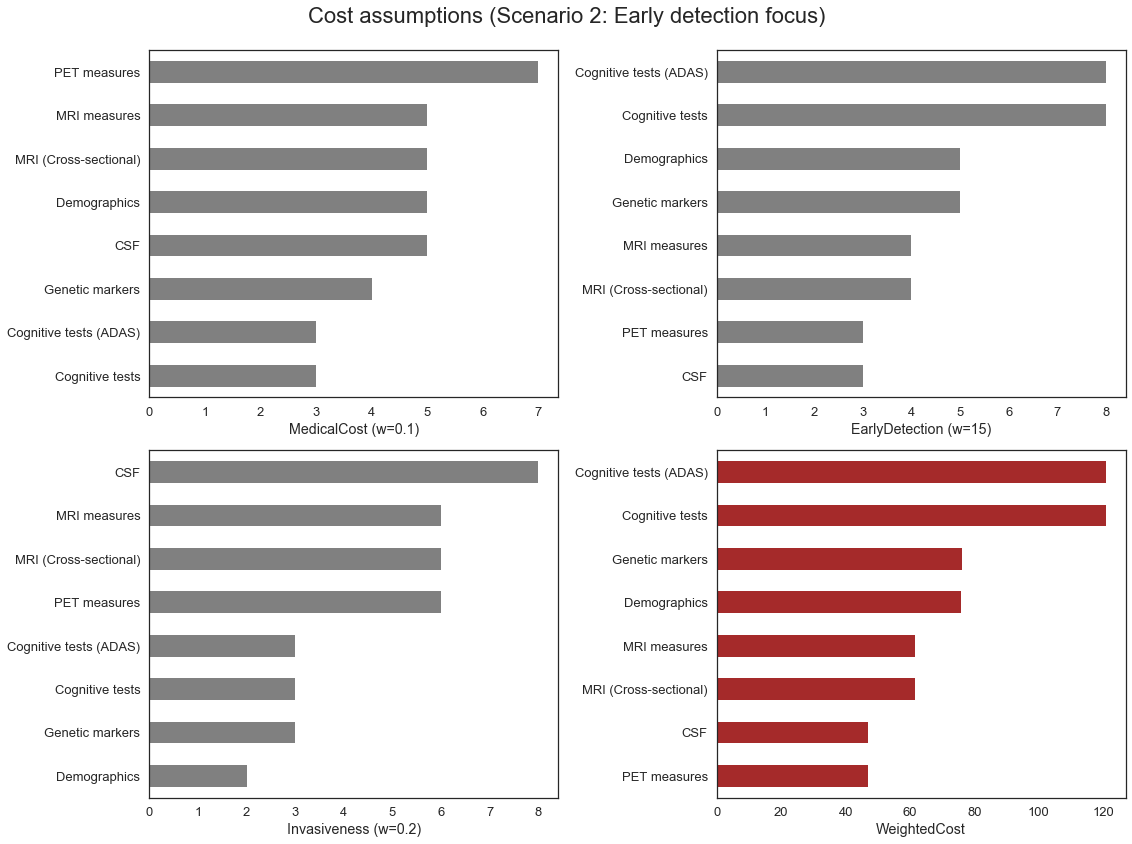
| ValidationAccuracy | TestAccuracy | CostMeasure | Score | |
|---|---|---|---|---|
| + CSF | 0.4974 | 0.4919 | 0.471 | 0.0264 |
| + PET measures | 0.5061 | 0.4837 | 0.940 | -0.4339 |
| + MRI measures | 0.5497 | 0.5447 | 1.557 | -1.0073 |
| + MRI (Cross-sectional) | 0.5393 | 0.5447 | 2.174 | -1.6347 |
| + Demographics | 0.5777 | 0.6179 | 2.933 | -2.3553 |
| + Genetic markers | 0.5829 | 0.5894 | 3.693 | -3.1101 |
| + Cognitive tests | 0.7679 | 0.8049 | 4.902 | -4.1341 |
| + Cognitive tests (ADAS) | 0.7679 | 0.8089 | 6.111 | -5.3431 |
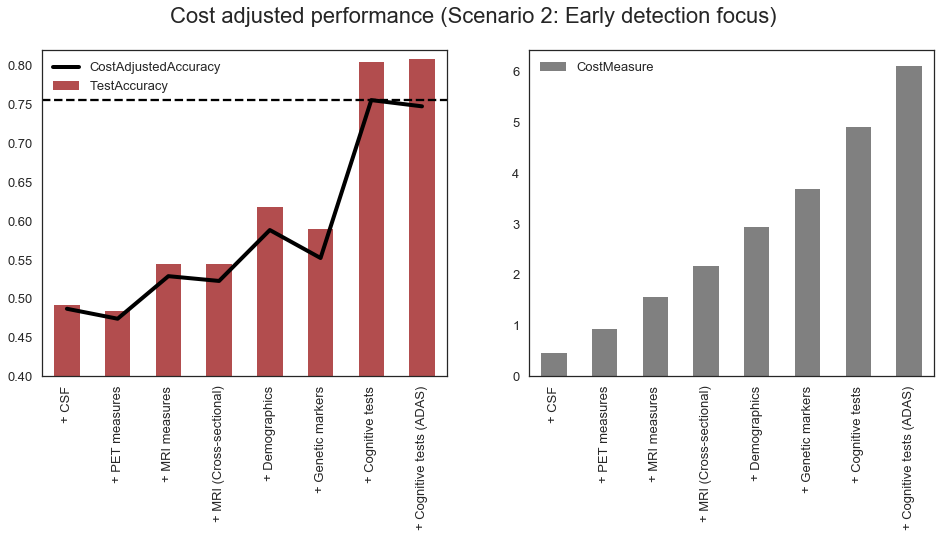
From above, we can see that when assigning high weight to the early detection cost, the methods more suitable for early detection are selected first based on the cost/accuracy score, such as CSF and PET, despite lower overall accuracy. On the other hand, the cognitive tests, despite having high accuracy, are selected the last because they contribute the least to the early detection power of our model.
Scenario 3: Medical cost priority
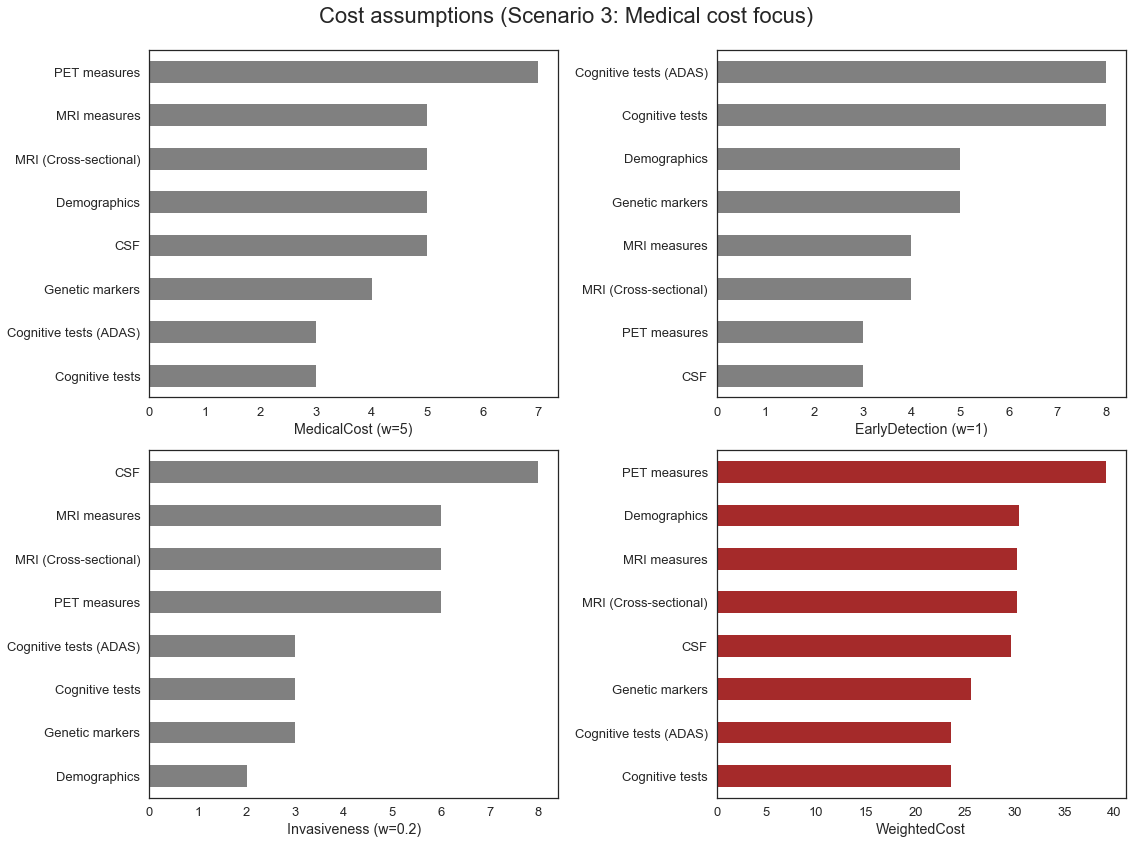
| ValidationAccuracy | TestAccuracy | CostMeasure | Score | |
|---|---|---|---|---|
| + Cognitive tests | 0.7592 | 0.7967 | 0.236 | 0.5232 |
| + Cognitive tests (ADAS) | 0.7487 | 0.7398 | 0.472 | 0.2767 |
| + Genetic markers | 0.7435 | 0.7846 | 0.728 | 0.0155 |
| + MRI measures | 0.7714 | 0.7764 | 1.030 | -0.2586 |
| + CSF | 0.7679 | 0.7805 | 1.326 | -0.5581 |
| + Demographics | 0.7661 | 0.7927 | 1.630 | -0.8639 |
| + MRI (Cross-sectional) | 0.7696 | 0.8089 | 1.932 | -1.1624 |
| + PET measures | 0.7661 | 0.8252 | 2.324 | -1.5579 |
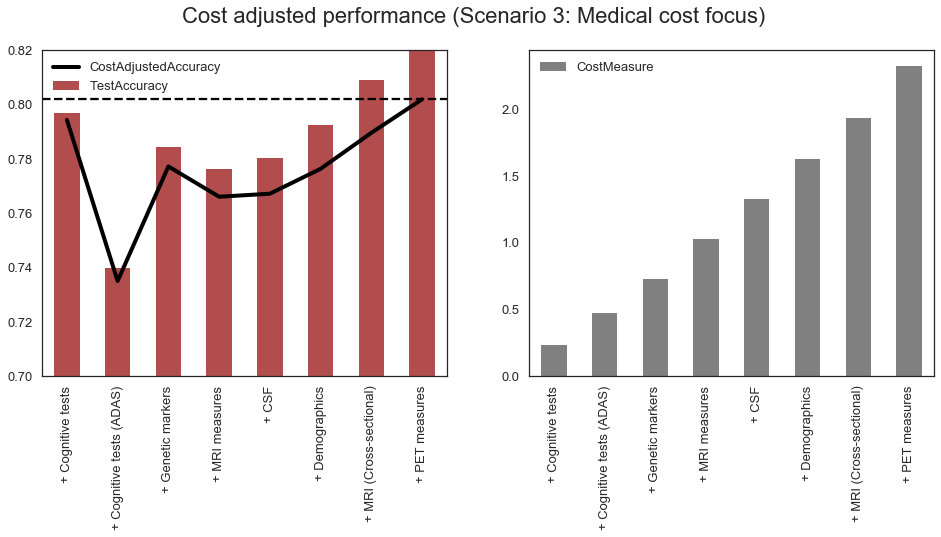
We can see that if the weight on the Medical Cost is high enough, our model will preferentially choose “cheaper” categories first, and the most expensive ones, such as PET, later, in spite of increased accuracy with PET category in our model.