ADAS Question Analysis
Contents
Introduction
In this section, we take a closer look at the breakdown of responses to the ADAS-13 questionnaire. We saw in the EDA that the ADAS scores were among the most significant predictors in our various baseline models. We will examine whether certain questions in the questionnaire play a greater role in diagnoses than others.
Gradient Boost
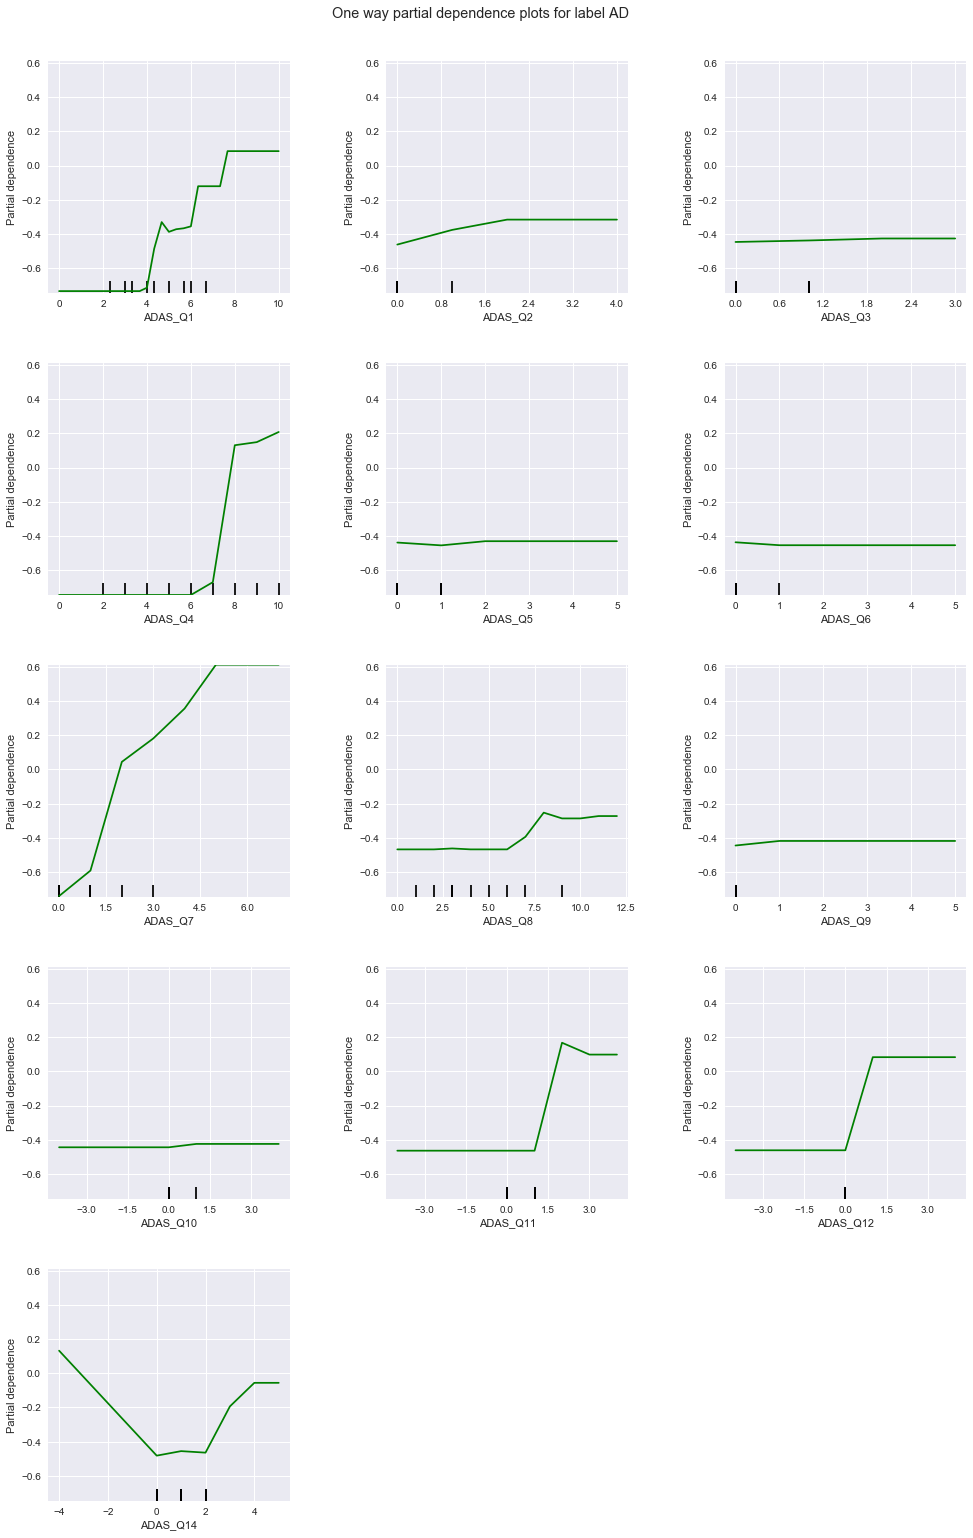
We will first use a gradient boosted model to determine the effect of individual questions on each diagnosis class, by looking at the partial dependence plots.
/Users/justinlee/anaconda2/envs/py3k/lib/python3.6/site-packages/sklearn/model_selection/_search.py:667: DeprecationWarning: The grid_scores_ attribute was deprecated in version 0.18 in favor of the more elaborate cv_results_ attribute. The grid_scores_ attribute will not be available from 0.20
  DeprecationWarning)
| estimator | min_score | mean_score | max_score | std_score | learning_rate | n_estimators | |
|---|---|---|---|---|---|---|---|
| 2 | GBM | 0.631579 | 0.728562 | 0.796296 | 0.050632 | 0.05 | 20 |
| 9 | GBM | 0.631579 | 0.724926 | 0.814815 | 0.056905 | 0.10 | 15 |
| 10 | GBM | 0.631579 | 0.724926 | 0.814815 | 0.060836 | 0.10 | 20 |
| 6 | GBM | 0.631579 | 0.724926 | 0.814815 | 0.065114 | 0.05 | 40 |
| 25 | GBM | 0.631579 | 0.724924 | 0.796296 | 0.051825 | 0.20 | 15 |
| 7 | GBM | 0.631579 | 0.724893 | 0.796296 | 0.063120 | 0.05 | 45 |
| 18 | GBM | 0.618182 | 0.723075 | 0.796296 | 0.062154 | 0.15 | 20 |
| 17 | GBM | 0.631579 | 0.723041 | 0.796296 | 0.058960 | 0.15 | 15 |
| 8 | GBM | 0.631579 | 0.723006 | 0.796296 | 0.047902 | 0.10 | 10 |
| 5 | GBM | 0.631579 | 0.721289 | 0.814815 | 0.061748 | 0.05 | 35 |
0.66789667896678961
Based on the results of our bootstrapping, we use a learning rate of 0.1 with 20 estimators to train our GBM. This gives us an accuracy of 0.668.
**************************************************
**************************************************
**************************************************
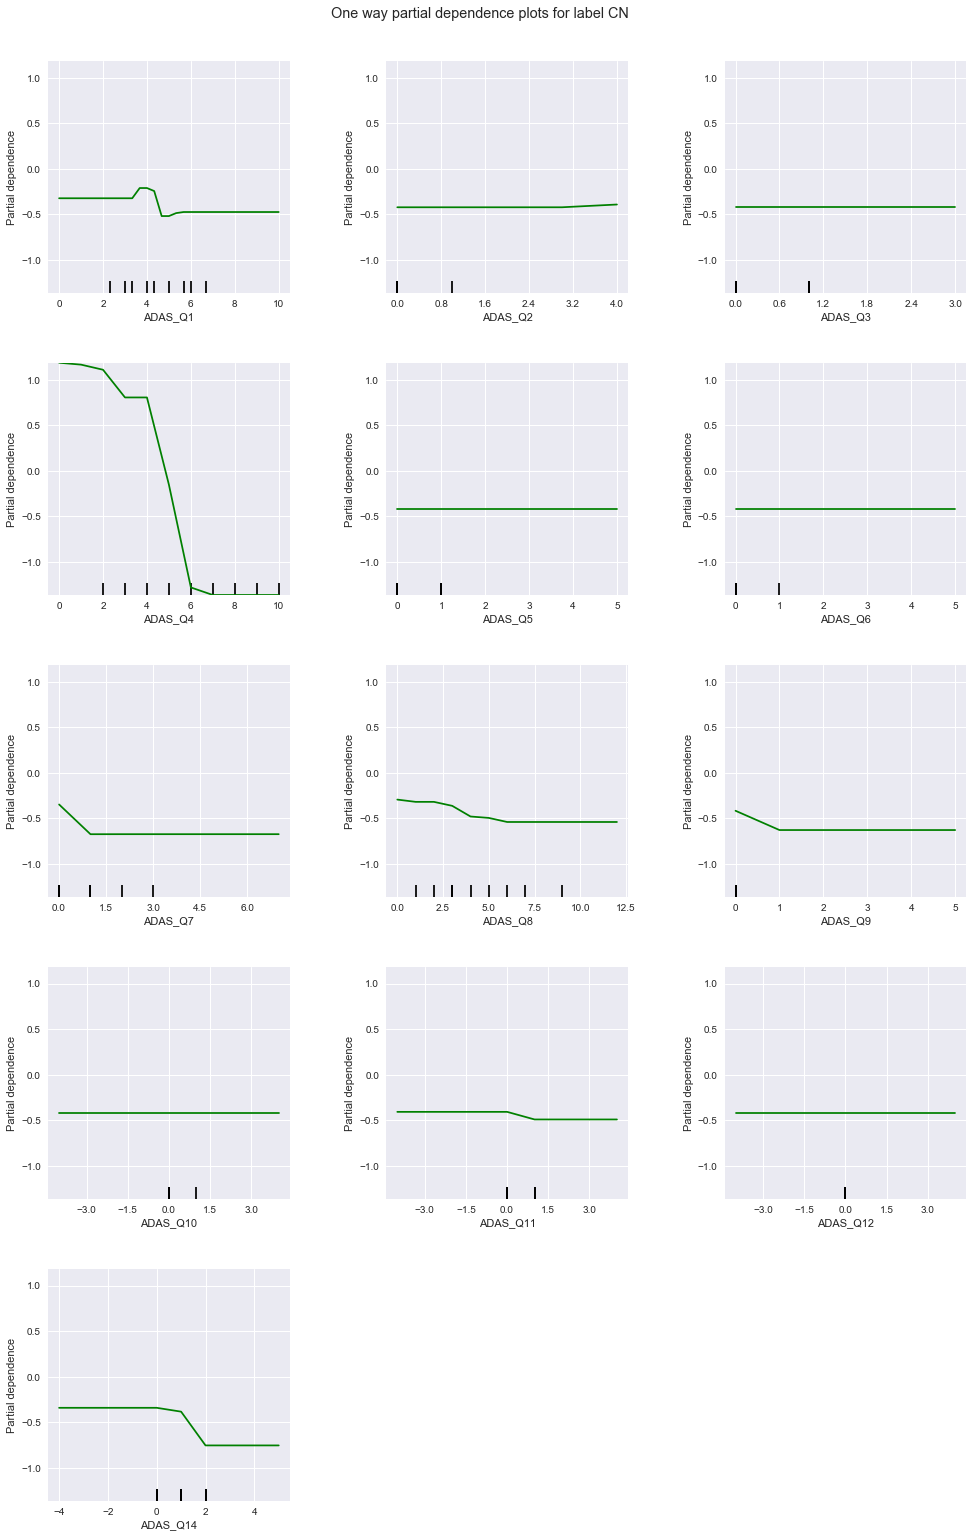
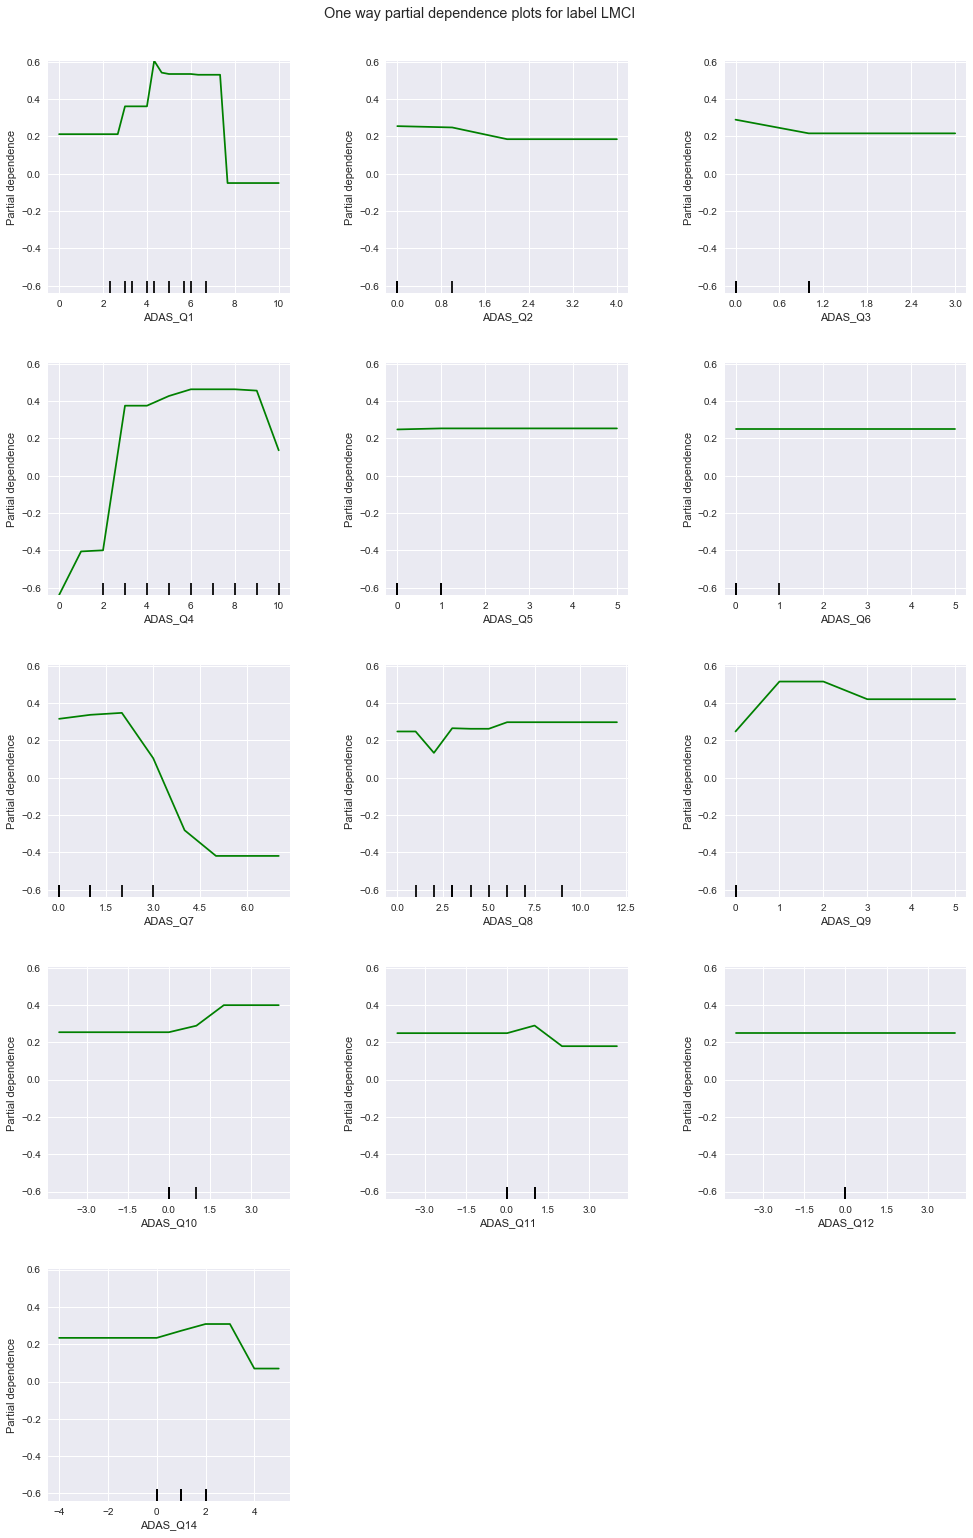
From the above charts, the degree of correlation and applicable response values of each question to each diagnosis are summarized in this table:
| ADAS Q# | CN | LMCI | AD |
|---|---|---|---|
| 1 | weak, lower values | strong, low to mid values | strong, higher values |
| 2 | uniform | strong, high values | uniform |
| 3 | uniform | uniform | uniform |
| 4 | strong, low values | strong, high values | strong, high values |
| 5 | uniform | uniform | uniform |
| 6 | uniform | uniform | uniform |
| 7 | weak, low values | strong, low values | strong, high values |
| 8 | strong, low values | uniform | uniform |
| 9 | uniform | strong, high values | uniform |
| 10 | uniform | uniform | uniform |
| 11 | weak, low values | uniform | weak, high values |
| 12 | uniform | uniform | uniform |
| 14 | weak, low values | strong, low values | strong, high values |
Among these, questions 1, 4, 7, and 14 seem to be sensitive to all diagnoses - 4 is particularly so. Questions 2 and 9 are strongly correlated to LMCI only, while question 8 is correlated to CN only. No question is strongly correlated to only AD. Based on the above, we train a GBM (1) on only questions 1, 4, 7, and 14, followed by (2) questions 1, 2, 4, 7, 8, 9, and 14.
/Users/justinlee/anaconda2/envs/py3k/lib/python3.6/site-packages/sklearn/model_selection/_search.py:667: DeprecationWarning: The grid_scores_ attribute was deprecated in version 0.18 in favor of the more elaborate cv_results_ attribute. The grid_scores_ attribute will not be available from 0.20
  DeprecationWarning)
| estimator | min_score | mean_score | max_score | std_score | learning_rate | n_estimators | |
|---|---|---|---|---|---|---|---|
| 17 | GBM | 0.631579 | 0.730314 | 0.781818 | 0.048436 | 0.15 | 15 |
| 16 | GBM | 0.631579 | 0.728629 | 0.796296 | 0.055383 | 0.15 | 10 |
| 9 | GBM | 0.631579 | 0.728562 | 0.796296 | 0.049334 | 0.10 | 15 |
| 8 | GBM | 0.614035 | 0.726708 | 0.796296 | 0.050781 | 0.10 | 10 |
| 18 | GBM | 0.631579 | 0.726676 | 0.800000 | 0.050542 | 0.15 | 20 |
| 24 | GBM | 0.631579 | 0.726676 | 0.781818 | 0.049316 | 0.20 | 10 |
| 21 | GBM | 0.614035 | 0.724888 | 0.818182 | 0.055321 | 0.15 | 35 |
| 15 | GBM | 0.614035 | 0.724856 | 0.818182 | 0.060087 | 0.10 | 45 |
| 26 | GBM | 0.614035 | 0.724856 | 0.818182 | 0.061218 | 0.20 | 20 |
| 11 | GBM | 0.631579 | 0.724825 | 0.800000 | 0.052335 | 0.10 | 25 |
0.7232472324723247
Using only the four questions above, our new GBM with learning rate 0.2 and 10 estimators achieves an accuracy of 0.723, marginally better than the GBM with all questions as features.
We now take a look at another model that uses a wider subset comprised of questions 1, 2, 4, 7, 8, 9, and 14. These questions respond in some capacity to one or more of the diagnosis classes.
/Users/justinlee/anaconda2/envs/py3k/lib/python3.6/site-packages/sklearn/model_selection/_search.py:667: DeprecationWarning: The grid_scores_ attribute was deprecated in version 0.18 in favor of the more elaborate cv_results_ attribute. The grid_scores_ attribute will not be available from 0.20
  DeprecationWarning)
| estimator | min_score | mean_score | max_score | std_score | learning_rate | n_estimators | |
|---|---|---|---|---|---|---|---|
| 19 | GBM | 0.596491 | 0.708337 | 0.777778 | 0.056152 | 0.15 | 25 |
| 7 | GBM | 0.614035 | 0.708172 | 0.796296 | 0.054997 | 0.05 | 45 |
| 12 | GBM | 0.614035 | 0.708106 | 0.796296 | 0.056464 | 0.10 | 30 |
| 20 | GBM | 0.614035 | 0.706455 | 0.777778 | 0.057586 | 0.15 | 30 |
| 26 | GBM | 0.614035 | 0.704701 | 0.796296 | 0.052903 | 0.20 | 20 |
| 15 | GBM | 0.611111 | 0.704502 | 0.767857 | 0.054983 | 0.10 | 45 |
| 27 | GBM | 0.614035 | 0.703015 | 0.796296 | 0.053590 | 0.20 | 25 |
| 28 | GBM | 0.614035 | 0.702783 | 0.759259 | 0.045174 | 0.20 | 30 |
| 25 | GBM | 0.631579 | 0.702619 | 0.777778 | 0.044256 | 0.20 | 15 |
| 14 | GBM | 0.596491 | 0.701030 | 0.796296 | 0.063266 | 0.10 | 40 |
0.69741697416974169
To summarize: compared to our full-questionnaire classification accuracy of 0.668, our first modified classifier performed slightly better at 0.723, while our seccond performed slightly worse at 0.697.
Logistic Regression
We perform the same analysis as above but with logistic regression. We will then examine the statistical significance of each predictor and compare these results against the above.
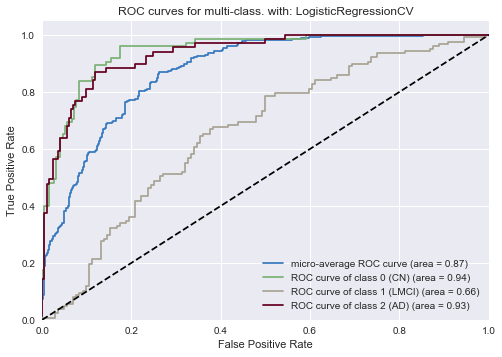
As was the case in the logistic regressin for all features, the ROC curve for our ADAS-quesionnaire logistic classifier shows good performance on the two extreme diagnoses (Cognitively Normal and Alzheimer’s Disease) and slightly worse performance on the middle diagnosis (LMCI).
We now examine the significance of individual ADAS questions as we did for the GBM.
We perform a t-test at the 90% level on the logistic regression model coefficients, using the result of 100-iteration averaged predictors. This yields the below results:
| Question | t-value | Significant at 90% ? |
|---|---|---|
| 1 | 1.965 | Yes |
| 2 | 0.449 | No |
| 3 | 1.362 | No |
| 4 | 4.183 | Yes |
| 5 | 0.187 | No |
| 6 | 0.136 | No |
| 7 | 2.920 | Yes |
| 8 | 0.634 | No |
| 9 | 1.098 | No |
| 10 | 0.251 | No |
| 11 | 1.441 | No |
| 12 | 0.493 | No |
| 14 | 1.846 | Yes |
We see that questions 1, 4, 7 and 14 are signficant at 90% (and with the close exception of 14, are also significant at 95%), just as before with our GBM. We will now train a new logistic regression model on these four features only.
The cross validated parameter is: [ 0.1  1.   1. ]


0.7232472324723247
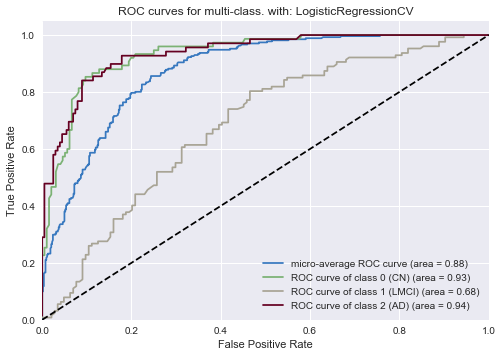
On the whole, using just the four questions yields a slightly better logistic model than before. While our new model yields comparable results to the whole-questionnaire model for the CN and AD classes, we observe marginally improved performance for the LMCI class (0.68 from 0.66 previously). Overall, the improved performance in this new classifier is in line with our observations in the GBM analysis. The logistic regression analysis gives us the added benefit of having a way to quantify the statistical significance of each predictor.